
Image source: wral.com
Some Wall Street insiders are anxious because of a chart indicating the stock market is following the same patterns, month by month, seen before the great stock market crash of 1929.
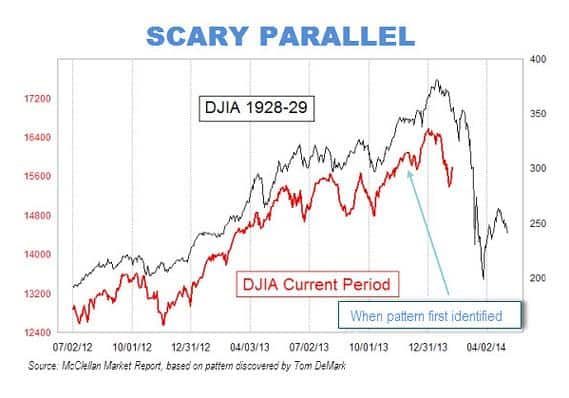
Most historians blame the 1929 stock market crash for triggering the Great Depression [1] in the United States and the chain of events that led to World War II [2]. (See the chart below.)
“In fact, the stock market is right now tracing out a pattern [3] eerily similar to the lead up to the infamous 1929 market crash,” Anthony Mirhaydari, a writer for The Wall Street Journal’s Market Watch noted.
The frightening patterns were first identified in November by market analyst Tom DeMark and since then the 1929 chart has been the subject of intense debate on stock market blogs. The chart shows a near-identical parallel between the 1928-29 market and today’s market, stretching back to the middle of 2012.
The highest profile figure [4] to embrace the chart is hedge fund manager and CNBC regular Douglas Kass who thinks a 1929-style crash is imminent.
“Yet the market over the last two months has continued to more or less closely follow [5] the 1928-29 pattern outlined in that two-months-ago chart,” Wall Street Journal columnist Mark Hulbert wrote on Feb.11. “If this correlation continues, the market faces a particularly rough period later this month and in early March.”
New book reveals gold-buying secrets that dealers don’t want you to know about… [6]
Hulbert was initially a skeptic who doubted the chart but recent market movements have made him a believer. Hulbert now thinks that some sort of major correction or crash in the overheated stock market is imminent.
What are the Wall Streeters so Scared of?
 [7]Basically, the Wall Street insiders are afraid of a stock market bubble. In a bubble stocks become overvalued but the bubble [8] eventually bursts and prices fall. If prices fall, suddenly a crash or fast exit of money from the market occurs. The 1929 stock market crash was essentially the bursting of such a bubble.
DeMark thinks that a crash and a major bear market or market downturn will occur if the S&P (Standard & Poor’s) 500 reaches a level of 1762. The S&P 500 is a list of the 500 most valuable publicly traded companies in America. On Feb. 11 the S&P 500 had hit a level of 1820.90 [9] or a hundred points over the level DeMark warned about.
During the 1929 crash the stock market lost around 44 percent of its value in a short period of time. Even skeptics of the chart theory such as Matthew Boesler and Andy Kiersz believe that the market could lose 24 [10] percent of its value in an upcoming crash.
Effect on the Economy Unknown
“While investment history doesn’t necessarily repeat itself, it does rhyme,” Kass wrote in a recent email. He believes “the correction might have just started.”
The stock market’s behavior is similar to that in 1929. That doesn’t mean a depression is imminent because the market’s effect on the overall economy would be different after all the world and the nation have changed greatly since 1929. The 1929 crash led to the Great Depression but the crash of 1987 [11] didn’t lead to a depression, and neither did a similar crash in 1907.
Sign up for Off The Grid News’ weekly email and stay informed about the issues important to you [12]
 [13]
[13]